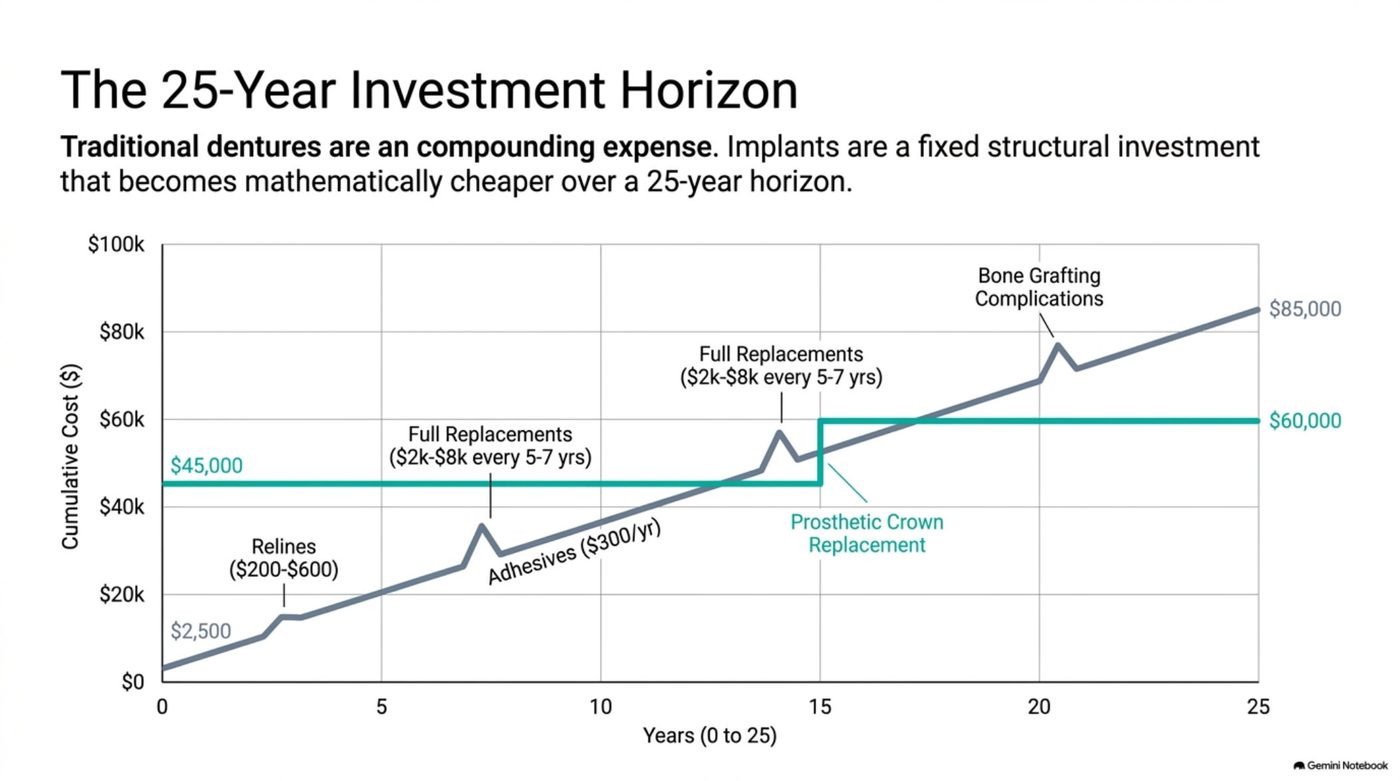
Dentures do not have a price. They have a payment schedule, and over 25 years that schedule compounds. A fixed implant arch is the reverse: a front-loaded structural investment that stops generating new charges once it is placed. Run both on the same ledger and the arithmetic reverses — the cheaper option is not the cheaper one. Most people who read this are comparing cosmetic dental treatment options around Cedar Rapids, IA, so what follows sticks to the details that change in practice.
The deck's 25-year model puts the denture path at roughly $85,000 cumulative, against about $60,000 for a fixed full-arch restoration. Neither is a guess; both are the sum of specific, recurring line items. This is the ledger, line by line. For the broader framing of how a smile investment is planned, see our smile investment prospectus.
The short version
- A 25-year model puts the denture path at roughly $85,000 cumulative against about $60,000 for a fixed full-arch restoration, reversing the assumption that dentures are the cheaper choice.
- Denture costs never stop: adhesives run about $300 a year, relines cost $200 to $600 every one to three years, and full replacements cost $2,000 to $8,000 every five to seven years.
- Across 25 years those four to five replacement cycles alone contribute $8,000 to $40,000, and none of that spending buys a permanently better result than the baseline.
- The fixed arch sits flat at about $60,000 from year zero through year 20, while the denture line crosses over between year 20 and year 25 and then widens every year for life.
- Without tooth-root stimulation the jaw loses roughly 25% of its ridge width in the first year, which drives higher reline frequency and the bone-grafting costs topping the $85,000 figure.
- Dentures restore only 20 to 30 percent of natural bite force, so the more expensive long-run path is also delivering the lower functional result.
What actually drives the denture line
| Cost driver | Denture path | Fixed implant arch path |
|---|---|---|
| Initial prosthesis | Full set, then replaced on a cycle | One arch, fabricated once |
| Adhesives | About $300 per year, indefinitely | None |
| Relines | $200–$600 per reline, every 1–3 years | Occasional prosthetic maintenance |
| Full replacement | $2,000–$8,000 every 5–7 years | Not required on the same cycle |
| Bone grafting and complications | Rises over time as resorption advances | Reduced by active bone stimulation |
| 25-year cumulative | About $85,000 | About $60,000 |
The ledger, year by year
On the upper band of every driver — $8,000 per replacement set, $600 relines every two years, $300 a year in adhesives, and bone grafting costs arriving as resorption compounds — the denture line tracks like this:
| Year | Denture ledger (cumulative) | Fixed-arch ledger (cumulative) |
|---|---|---|
| 0 | $8,000 — initial full set | $60,000 — surgical posts and final arch |
| 5 | $10,700 | $60,000 |
| 10 | $22,000 | $60,000 |
| 15 | $37,700 | $60,000 |
| 20 | $59,000 | $60,000 |
| 25 | $85,000 | $60,000 |
The crossover sits between year 20 and year 25. Before that point, the denture path looks cheaper; after it, the gap widens every year for the rest of the patient's life.
The compounding mechanic
The denture line never stops because each of its drivers is on a timer. Adhesives cost $300 a year whether or not anything goes wrong. Relines arrive every 1–3 years as the gum ridge changes shape. Full replacements land every 5–7 years, which means four to five replacement cycles across a 25-year horizon. Add those cycles and the replacements alone contribute $8,000–$40,000. None of it is optional, and none of it buys a permanently better result — it restores the same baseline.
Why the implant line is front-loaded and flat
A fixed arch is priced once. The surgical placement and the final prosthesis account for nearly the whole figure, and after that the annual carrying cost is maintenance rather than replacement. The implant line is not perfectly flat forever — hygiene appointments and occasional prosthetic servicing are real — but those costs behave like dentistry, not like a replacement cycle. Even if you charged $500 a year of maintenance for 25 years, that adds $12,500 to a $60,000 base and still lands well under the denture ledger.
The tail that makes the gap wider: bone loss
The denture ledger is generous to dentures in one respect. Without stimulation from tooth roots, the jawbone resorbs — roughly 25% of width is lost in the first year alone — and that change drives the reline frequency higher and forces the bone grafting and complication costs that sit at the top of the $85,000 figure. Implants act as artificial roots and stimulate the bone, which reduces the need for that spending rather than merely deferring it.
The real break-even
At the upper band, break-even arrives in the early-to-mid 20s. At the middle of every range — $5,000 replacements, $400 relines, $3,000 of initial work — the denture line reaches the fixed-arch figure years earlier. Either way the conclusion holds: the fixed arch is not the expensive option across a full horizon. It is the expensive option only if you look at year one.
What the ledger assumes
The models above hold two inputs constant so the comparison stays honest. First, that a denture patient keeps replacing on schedule — because that is what dentures require, not because the projection is pessimistic. Second, that the fixed-arch patient pays the whole structural cost up front and then carries only maintenance. Change either assumption and the ledger moves, but it does not reverse: there is no version of a 25-year horizon in which four to five replacement cycles cost less than one fabrication.
Reading the ledger as a patient
The useful output of this model is not a single number. It is the shape of the curve. The denture line rises in steps and keeps rising; the implant line rises once and flattens. If you are young enough that 25 years is a realistic planning window — or if you simply intend to still be eating normally in 20 years — the shape matters more than the entry price. If your horizon is genuinely short, the upfront saving is real and the ledger is the wrong lens. Most patients asking this question belong to the first group while looking at the second number.
A second reading matters just as much: the denture line is not only more expensive, it is more expensive while delivering a lower result. Bite force stays at 20–30% of natural, the prosthesis comes out nightly, and bone keeps resorbing underneath it. The $85,000 buys repeat restorations of a lower baseline rather than progress toward a better one.
Model your own horizon with the smile makeover cost guide, the veneer cost calculator, and the calculator suite. The full 25-year model behind these figures is in The Smile Architecture Blueprint.
Frequently Asked Questions
Does the $85,000 figure assume the worst case at every step?
It sits at the upper end of each driver, which is why it is presented as a ceiling rather than an average. A patient who replaces a full set every seven years at $2,000 and needs fewer grafting procedures will land far lower — but the fixed-arch figure does not move with those assumptions, so the comparison narrows rather than reverses.
Are there costs on the implant side that this misses?
Yes, and they should be counted: professional hygiene every 3–6 months and occasional prosthetic maintenance. Both are real, both are modest next to a replacement cycle, and neither resets the structure. That is the structural difference the ledger is measuring.
Why does the replacement cycle matter more than the purchase price?
Because a $2,000–$8,000 charge repeated four or five times outweighs a single lower purchase price. The denture wins on the first transaction and loses on the sequence, which is exactly the pattern a 25-year horizon exposes.